


Deep (Energy) Takes: Upgrading Our Energy Intuition!
Climate Change Equation, Eliminating 51 billion tons of CO2, Energy Units, US Sankey Diagram of Energy Consumption, US vs China vs Europe’s Power Mix, LCOEs, Industrial Electricity Tariffs, PPAs

Hi, Deep Takes Friends! 🧑🔬👋
Welcome to another deep takes series! We will explore the future of energy generation and storage in the United States. I’m particularly excited about diving into long-duration energy storage, hydrogen, geothermal, and nuclear energy.
This first post will cover some energy fundamentals and develop our energy intuition together. It will set us nicely for future deep (energy) takes posts.
Upgrading our Basic Energy Intuition
Simplifying Climate Change, Net Zero: Eliminating 51 billion tons of annual CO2 emissions, Basic Units of Energy, Sankey Diagram of US Energy Consumption, US vs China vs Europe’s Power Mix, LCOEs, Industrial Electricity Tariffs, Pay as Produced PPAs vs 24/7 Clean PPAs
You can skip this section if you are familiar with the fundamental concepts in italics. I’ll write about these concepts in future deep (energy) takes posts.
Climate Change Simplified


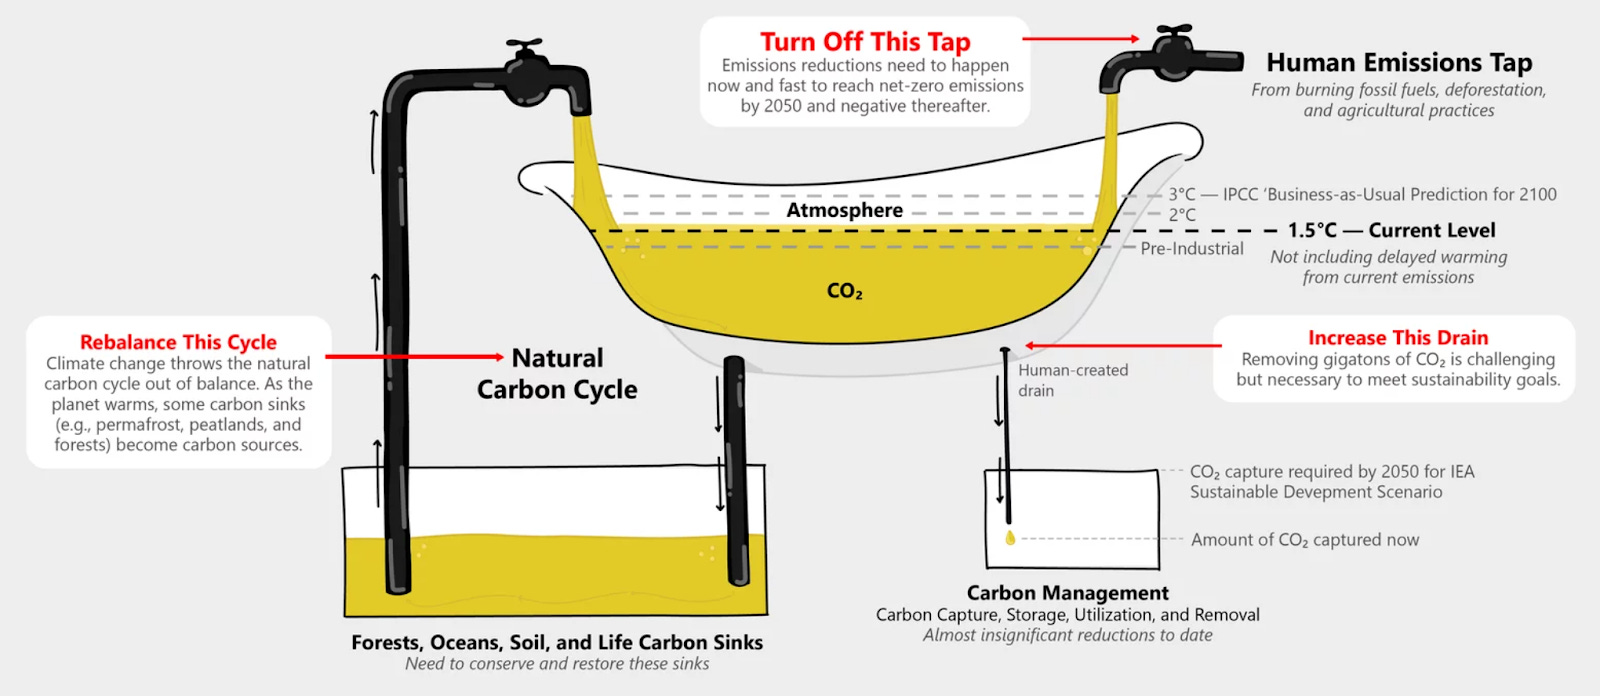
Greenhouse gases (like CO2) in the atmosphere cause long-term alteration to earth’s global surface temperatures. This alteration is what we know as climate change. Before human emissions, global surface temperatures were stable. To put it into an equation, the global surface temperature delta was equal to zero. Earth was able to keep this steady balance through the carbon cycle. As carbon moves around earth’s atmosphere, oceans, soil, and living organisms, carbon is absorbed by plants and sea and released into the atmosphere through animal respiration, decay, and natural processes like volcanic and other geological activity.
Before Human Emissions:
Temperature Δ = Tincrease (Carbon release) - Tdecrease (Carbon sink) = 0
Since the 1850s, human activities, including burning fossil fuels and other industrial processes, have overwhelmed natural carbon sinks and upset the temperature equilibrium. The carbon management tools we deploy, such as carbon capture, storage, and utilization, are making negligible reductions. In 2024, the average global surface temperature increase was about 1.5°C above the pre-industrial level (1850-1900), making it the warmest year on record. The consequences will only worsen and escalate rapidly if we continue business as usual because climate impacts worsen nonlinearly. If we continue our current trajectory, we are projected to reach temperatures 3°C higher than pre-industrial levels, which would have exponentially worsened heat waves, hurricanes, wildfires, droughts, and flooding worldwide.
After Human Emissions:
Temperature Δ = Tincrease (Carbon release) - Tdecrease (Carbon sink) + THuman Emissions - TCarbon Management
To cut to the chase, what must we do to completely halt this increase in temperature? Answer: Reduce global human emissions by 51 billion tons of CO2 annually.
We need solutions that will reduce emissions by billions at a time. We don’t have the luxury of wasting our resources and time on solutions that try to reduce emissions millions at a time (unless the solution's rate of improvement is nonlinear). Whenever you hear about a certain amount of CO2 being released, quickly divide that number by 50 billion. For example, the semiconductor manufacturing process releases about 75 megatons of CO2 annually, an unmeaningful 0.15% of total global emissions.
The five emission categories that make up the 51 billion tons of CO2 that we emit every year are:
Making things (like steel, cement, plastics) at 31%
Plugging into electricity at 27%
Growing stuff at 19%
Getting around in planes, trucks, cargo ships at 16%
Keeping warm and cool (heating, cooling, and refrigeration) at 7%
Power vs Energy and the Sankey Diagram of US Energy Consumption and Efficiency

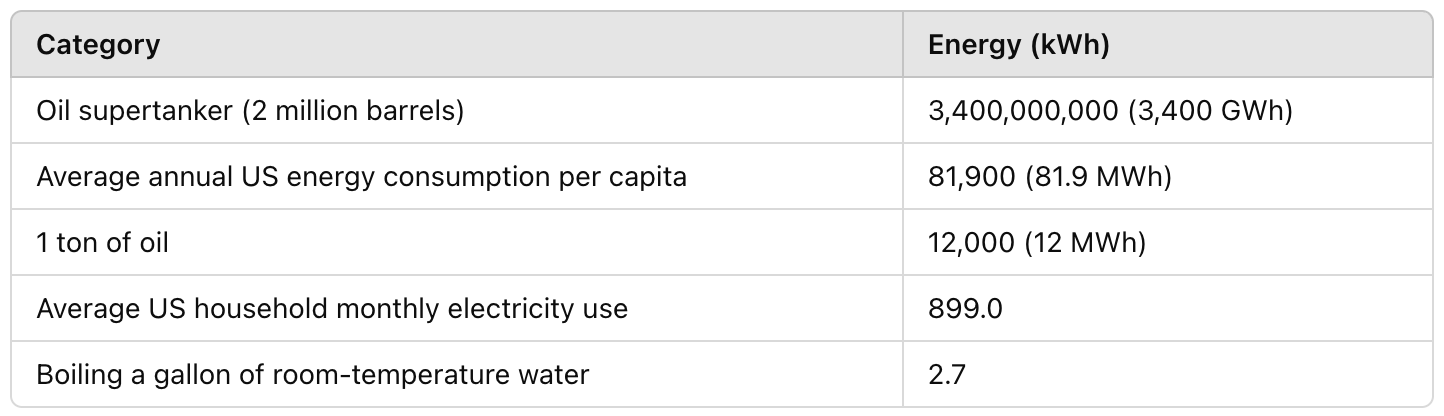
Let’s review the difference between the energy units watts and watt-hours because I’ll use these units often in my series. Let’s start with what energy is. Energy is a conserved quantity that can be accumulated and transferred as heat, work, and matter. If we use beer kegs to help us, consider energy analogous to the keg size (in pints) that stores beer. Power is the instantaneous rate of energy use or flow. You can think of power as the keg’s flow rate (pints/hour). Knowing the amount of beer we have and its flow rate, we know how long the beer will last us. Similarly, if we know the amount of energy stored and the power, we know how long we will have electricity.
It's also helpful to develop an intuition for the scale of these units and the types of systems or devices they typically power. The entire US has approximately 1100 GW of annual production capacity. In a few paragraphs, we will compare this number with China’s capacity when considering energy through geopolitics.

The other commonly used energy unit is watt-hour (Wh), the quantity of energy moved by a one-watt power source over an hour. Quads or one quadrillion (10¹⁵) British Thermal Units (BTUs) are used when characterizing the amount of energy countries use. The estimated US energy consumption was about 93.6 quads in 2023. BTUs give us an easy way to compare different energy sources. For instance, the energy contained in wood or gasoline can be measured by the heat produced in BTU. A BTU is the amount of thermal energy needed to raise the temperature of one pound of water to one degree Fahrenheit.

We now understand the difference between energy and power and can grasp the scale of these numbers. Let's switch gears and look at US energy production and consumption more broadly. Lawrence Livermore Laboratory’s annual Sankey energy flow diagrams (like the one shown above) tell us a lot about US energy production, consumption, and how efficiently we use energy. On the left-hand side are the energy resources like solar, natural gas, and coal. Energy flows from left to right.
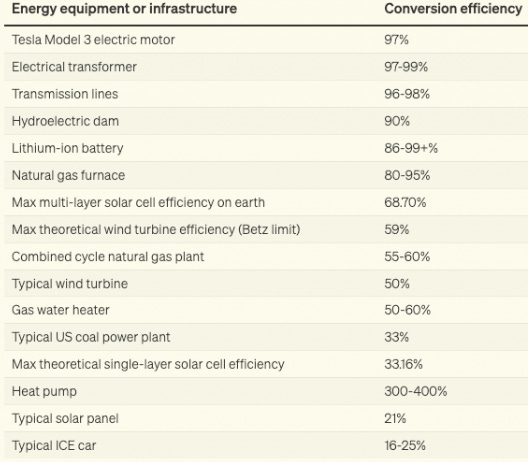
The notable takeaways from the diagram are that our energy infrastructure is built on hydrocarbons, and they are very inefficient to process! The US consumes about 80% of our energy from hydrocarbons (coal, natural gas, and petroleum), which are burned and converted to heat to produce work. The primary source of losses is from heat engine inefficiencies that convert heat to work. It is mindboggling that we ‘reject’ two-thirds of the energy we consume until you realize how inefficient hydrocarbon conversion is. Coal plants are about 35% efficient, combined cycle gas turbines are nearly 60%, and gas-powered cars are about 25%. Compare these efficiencies with their electrical counterparts. For instance, a Tesla Model 3 electric motor has a conversion efficiency of 97% compared to a maximum efficiency of 25% of a typical internal combustion engine car (can’t have 100% efficiency because the second law of thermodynamics states that there will always be losses when converting heat to work).
Energy Through Geopolitics: US vs China (vs Europe)


Advocates of ending climate change primarily care about radically changing our primary energy sources. They want as fast an acceleration away from hydrocarbons to solar and wind as possible because this will get us from 51 billion tons of CO2 a year to zero. Others look at it through a geopolitical lens. They don’t look at how our energy is generated but how much (total capacity) and at what cost.
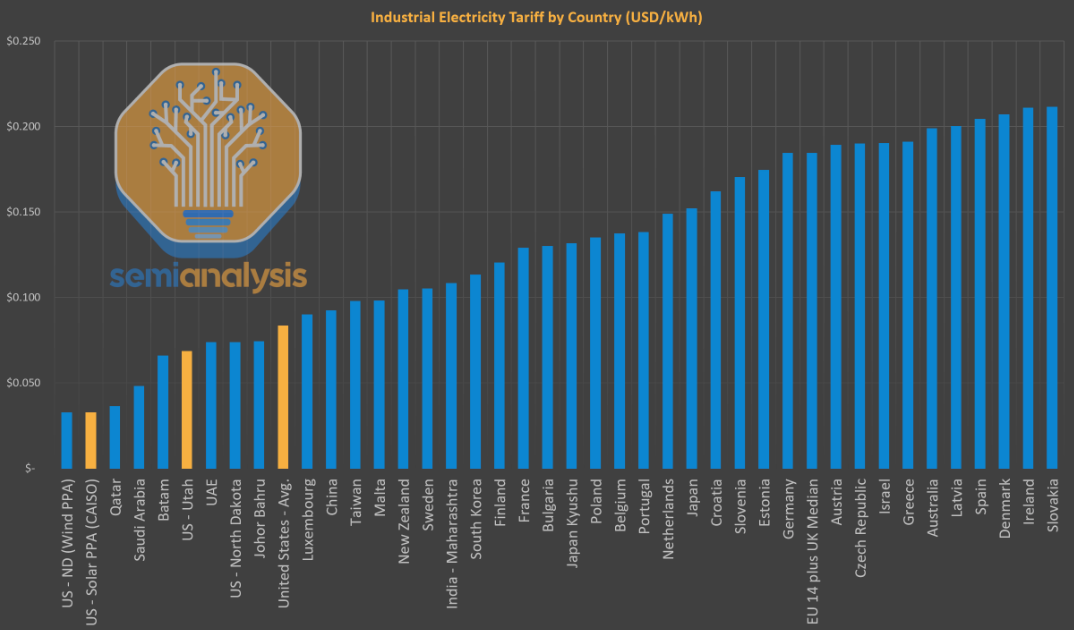
In this section, we examine energy through the lens of geopolitics. The US is in the (energy) Cold War 2.0 with China and is badly losing. First, the good news: Despite having relatively inefficient energy transmission, the US has the second lowest industrial electricity tariff in the world, at $0.083/kWh. The Middle East has the lowest electricity tariffs in the world at about $0.05/kWh on average. Electricity tariffs, in USD/kWh, are the price consumers pay per kilowatt-hour for electricity. Since the shale gas revolution in the 2000s, the US has been the world’s largest natural gas producer, with almost 40% of the electricity we generate fueled by natural gas. Meanwhile, China has an industrial electricity tariff of about $0.092/kWh which isn’t too far away. The average global industrial electricity tariff is just under $0.15/kWh.
The good news ends there. If you compare the electricity production capacity of the US vs China, the US has 1.1 TW of production capacity compared to China’s 3 TW. By 2050, China will have about 9 TW compared to our 3 TW. US energy generation at 4200 TWh annually has not increased since the early 2000s and costs three times more to build out energy capacity! Meanwhile, China has tripled its energy generation since 2005 and does not care about whether it generates clean energy; it only cares about generating more electricity. China is self-reliant on coal (with about 60% of its energy coming from it), but it also leads the world in renewable power installation. By 2050, about 90% of their energy will be through renewables. China also has about 20 nuclear reactors in the construction phase. They are planning to build 300 nuclear reactors and plan for these reactors to have 500 GW of energy capacity, about half of the current US energy capacity. Even though US industrial energy tariffs are slightly lower than those of China, China’s residential electricity tariffs are at $0.07/kWh, which is about half of US residential electricity tariffs. If the US does not get its act together in the next year or two, China will have the lowest industrial and residential electricity tariffs globally.
If the US does not catch up quickly, it will face massive headwinds as we try to bring manufacturing or computing power onshore. If you believe the cost of power will drive the AI industry, the US is in deep trouble because China is accelerating ahead with far more capacity and faster and cheaper capacity buildout.
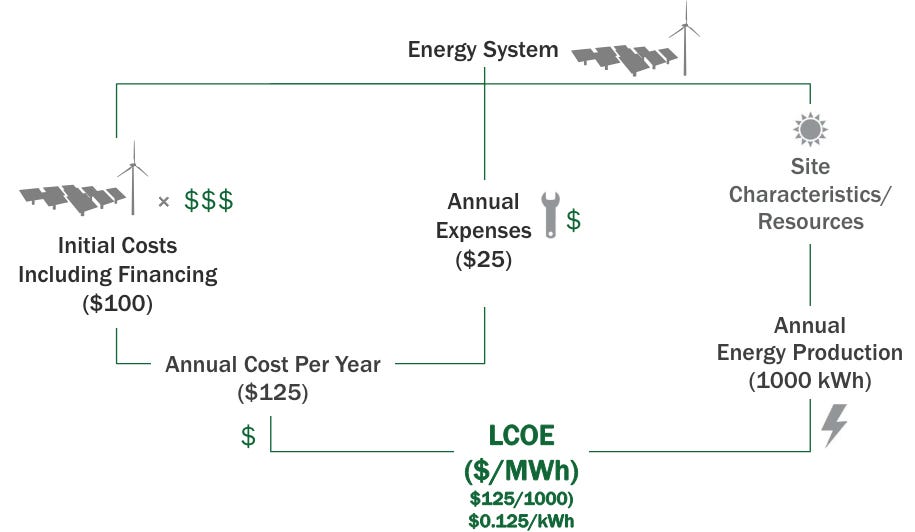

We just discussed how building US energy capacity will cost about three times as much as building that of China. But each energy source is so different. How do we compare the costs? The most common method is using a levelized cost of Energy (LCOE). LCOE gives an apples-to-apples basis for determining how much it costs to produce one unit of electricity over the lifetime of an energy project. It includes all the costs of building, running, and eventually retiring the energy source.
The diagram from the US Department of Energy shows us the main components of calculating LCOE. You add the initial costs with annual expenses and divide the number by yearly energy production. Solar, wind, and hydropower energy sources will have high upfront capital costs but low operating costs and no fuel costs. Contrast this with fossil fuel plants with low upfront capital costs but higher fuel costs (including emission controls and regulatory compliance). The expenses incurred to retire the plant safely and restore the site are also a significant part of the costs for nuclear plants.
Although LCOE is a valuable metric for comparing the cost of different electricity generation sources, it doesn’t consider that intermittent energy cannot provide power 24/7. Renewables like solar have lower overall LCOEs than nuclear, coal, and natural gas but can’t run when the sun is down. To generate reliable power at all times, backup systems like batteries or gas peaker plants need to be run, which makes intermittent sources cheaper than they are.