

Deep (Energy) Takes: Understanding Energy Learning Curves
Energy's Four Learning Curves, Marginal Cost of Electricity Goes to Zero, and the Why Behind Learning Curves: Complexity vs Customization Matrix

Hi Deep (Tech) Takes Friends! 🧑🔬👋
Our last post sharpened our energy intuition by exploring the energy industry's fundamental building blocks. We covered everything from the core of climate change to industrial electricity tariffs and LCOEs. If these terms sound unfamiliar, I highly recommend revisiting that post—it serves as a valuable reference for today’s discussion and future ones.

Now that we’ve built a solid foundation, we’re diving into energy learning curves. The energy industry has its version of Moore’s Law—Wright’s Law, also known as the learning curve—and we’ll introduce four key learning curves shaping the industry today. We’ll also explore why some energy technologies follow learning curves while others do not. By the end of the post, you’ll confidently be able to answer (for instance) why solar panels and wind turbines are on learning curves but why nuclear plants are not. Let’s dive right in!
Energy Learning Curves: The Magnificent Four
While the semiconductor industry is run on Moore’s Law, a few energy technologies follow Wright’s Law (or the learning curve). Wright’s Law originated from Theodore Wright, who noticed that the cost of making a specific type of plane tended to drop by about 20% every time the cumulative production of the aircraft doubled. It’s important to note that the cost per unit decreases by a fixed percentage every time (and only when) the total production doubles. Because cumulative production matters, you’ll see substantial cost reductions at first and then more minor improvements per amount produced. On the other hand, Moore's Law is about advances in transistor density and not about production volume.
Why are learning curves so crucial in the energy industry? Because they can help us predict which technologies will have the lowest LCOE and most likely be adopted in our fight against climate change.
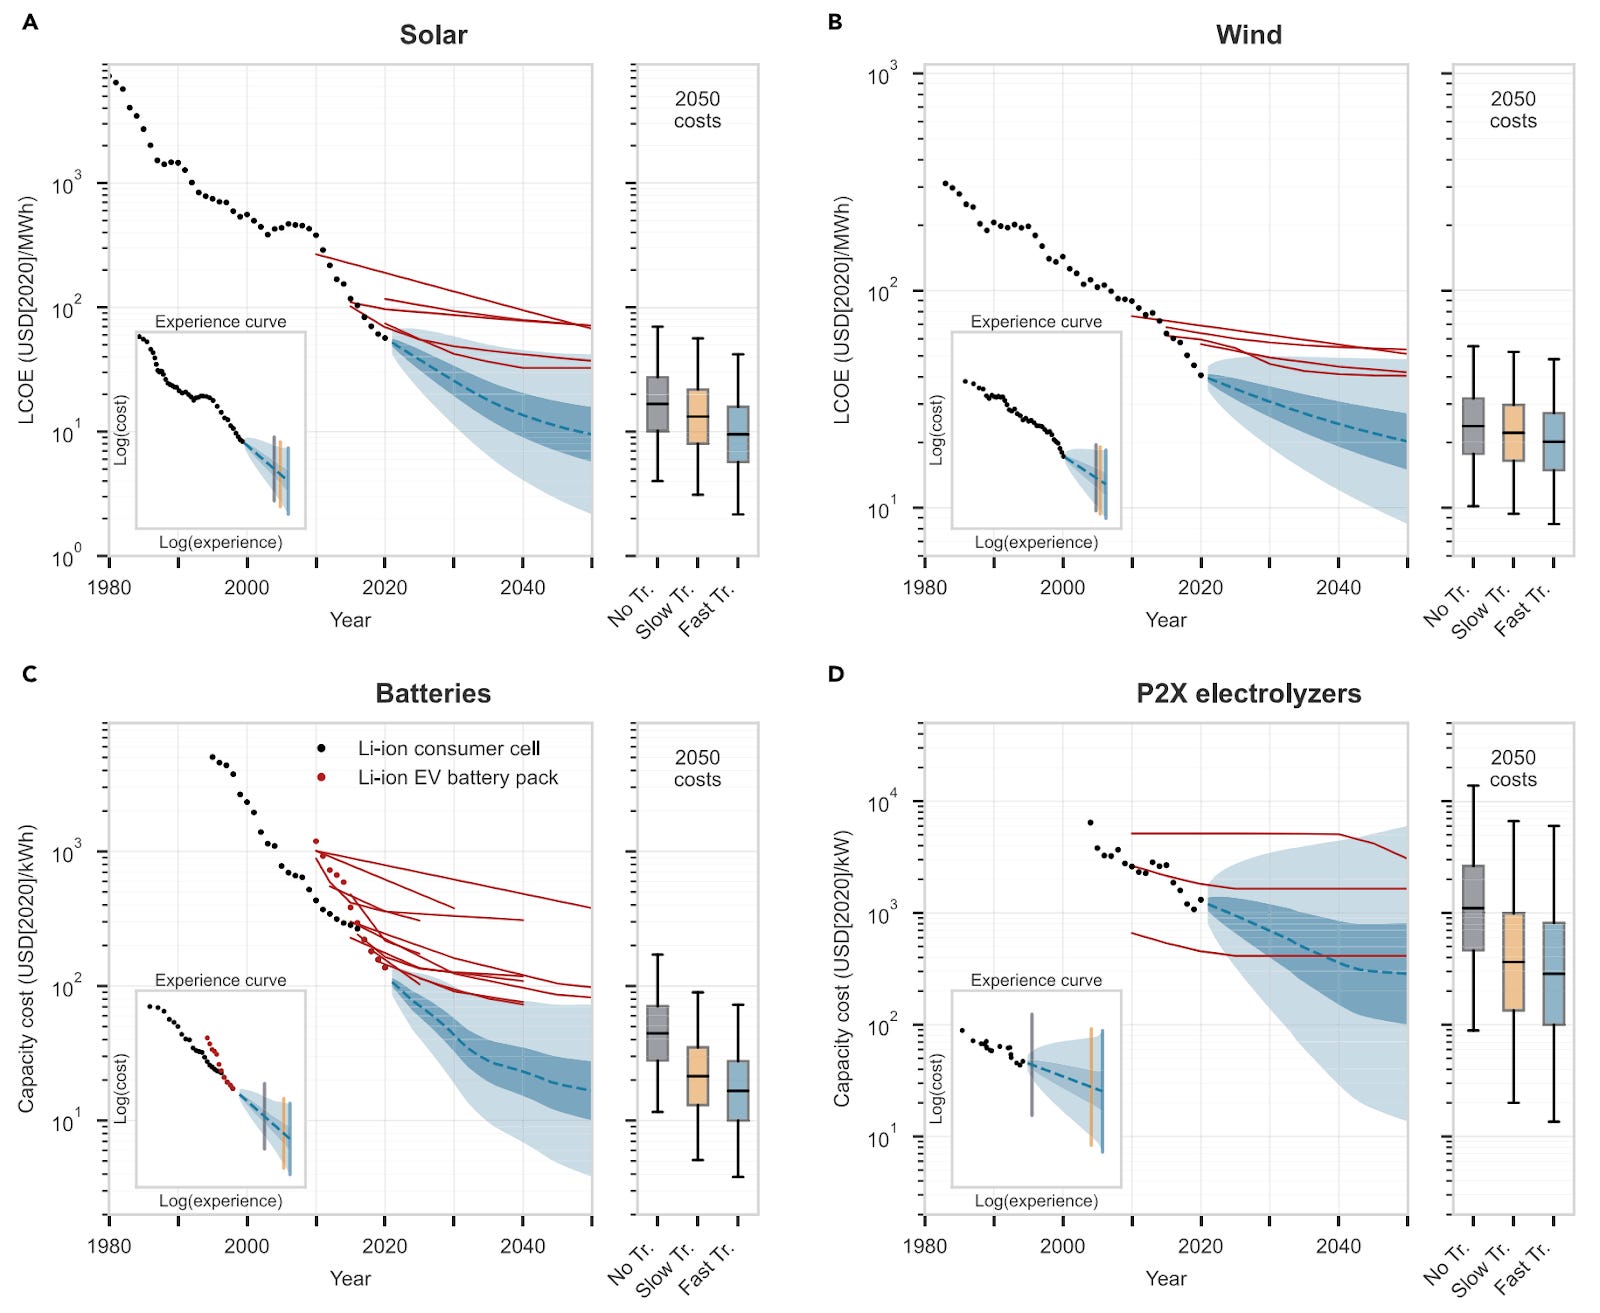
In his much-cited paper, ‘Empirically grounded technology forecasts and the energy transition, ' Oxford Professor Doyne Farmer conducted the most comprehensive look at learning curves.’ Professor Farmer (founded and sold Quant fund Prediction Company to UBS in 2006) argues that a rapidly decarbonized energy system by 2050 would save at least $12 trillion in global energy costs compared to continuing with our current fossil fuel-based energy system.
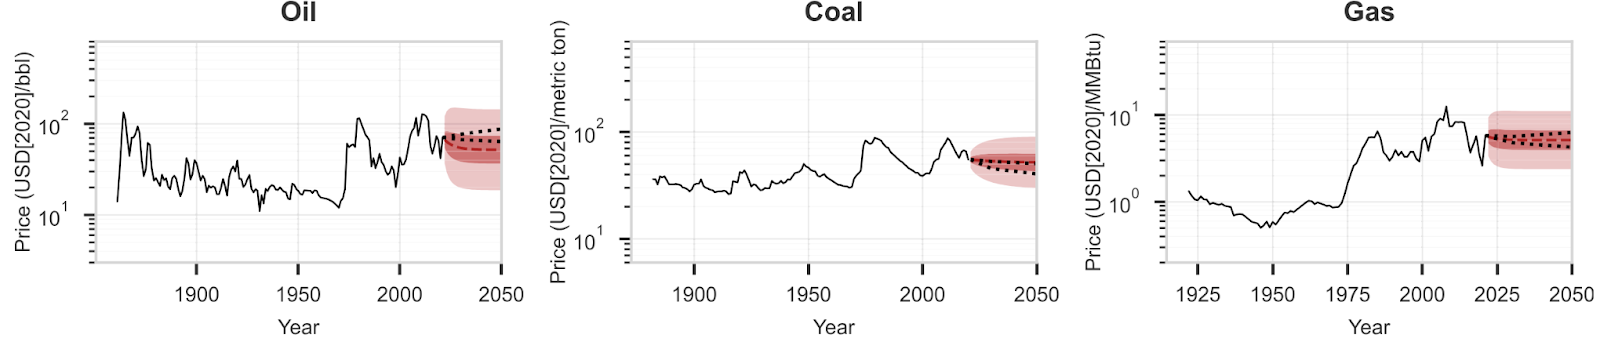
The most interesting part of the paper was the observation that solar, wind, batteries, and electrolyzers (I will write a separate post about the future of hydrogen and electrolyzers … stay tuned!) showed strong learning curves. Notice a couple of things from the charts above. First, despite advancements in automation and new mining machines, things we consume from the ground, like oil, coal, and natural gas, are roughly priced the same as a century ago. Even though the practice of mining is improving, it's eerily counterbalanced by how hard it is to dig out deeper minerals. Second, the red lines in the figure represent the International Energy Agency’s cost projections that have been entirely off the mark. We won’t get into why the IEA’s modeling has been so hilariously off the work in this post. Maybe in a future post. Third, consider solar and wind energy’s LCOE and convert it to $/kWh. An average US household uses about 30 kWh of energy daily and about 1000 kWh monthly. The chart above shows that by 2040, we will be at about 1 cents per kWh for solar power and 2 cents per kWh for wind power. The current US electricity tariff is about 17 cents per kWh.
This signifies that the marginal cost of generating electricity will be nearly zero in the next decade. In some parts of the world, zero marginal cost of electricity is already a reality. Most countries in the Middle East are already at lower than $0.02/kWh. In Australia, the cost of delivering energy from centralized power plants to a house exceeds the cost of rooftop solar. The main costs will be in the distribution of energy and energy storage, as seen in many parts of the US.
Let’s go further and understand why solar, wind, batteries, and electrolyzers are on learning curves while other technologies like carbon capture and storage (CCS) and nuclear power are not. To help us, we turn to Abhishek Malhotra and Tobias S. Schmidt and their recent paper, ‘Accelerating Low-Carbon Innovation.’ The authors lay out a practical framework (see the graph below) by categorizing all energy technologies based on how standardized vs customized they are and how complex vs simple they are.
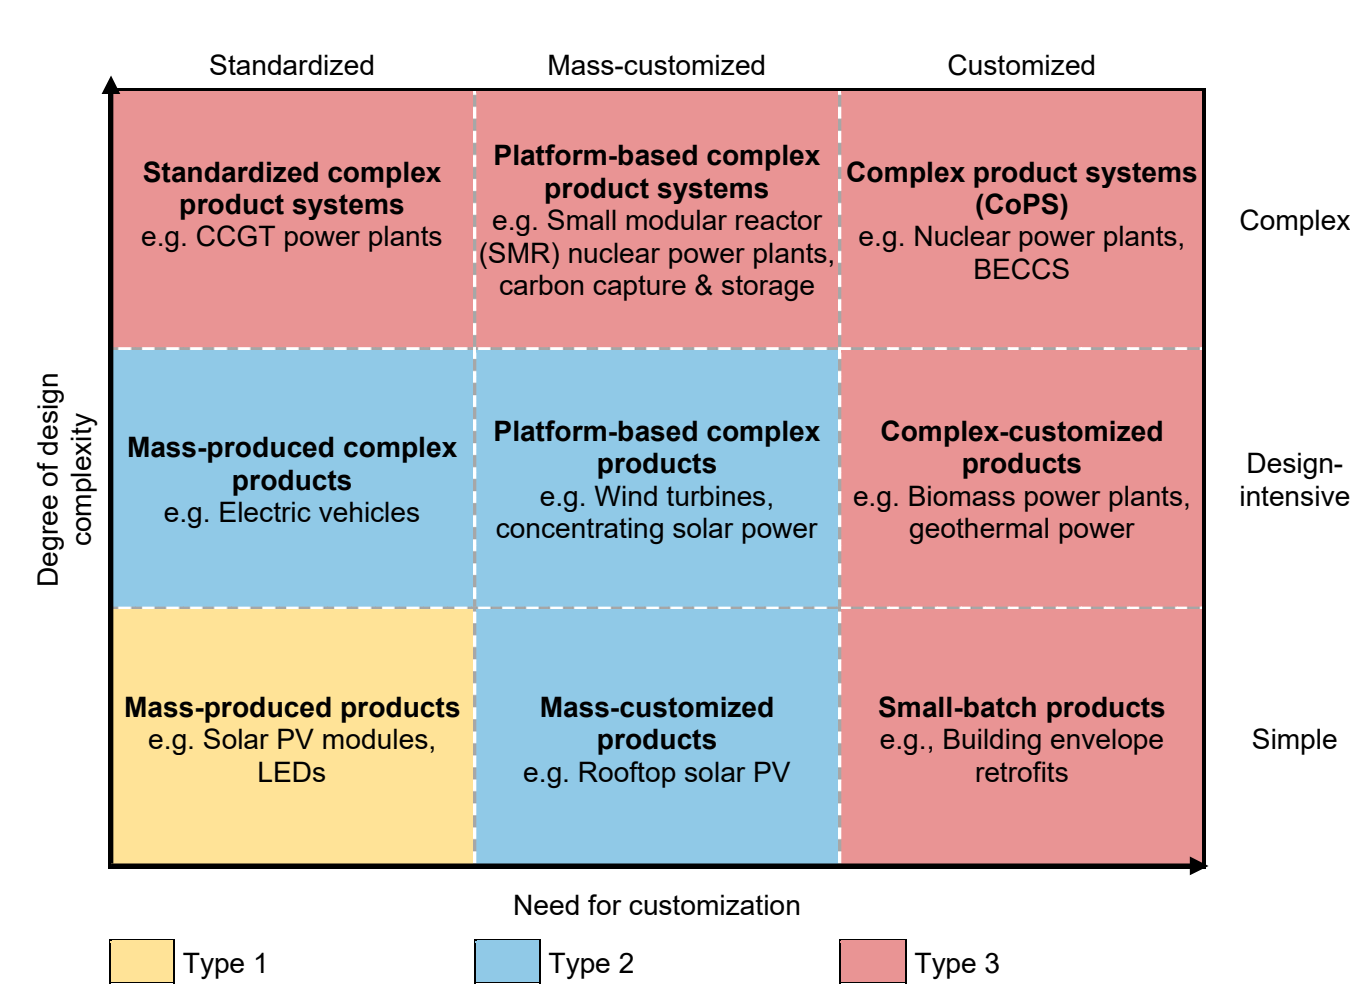
The authors have very particular definitions for complexity and customization in their paper. They define design complexity as how many components are needed to build a functioning piece of technology and how integral they are to the system. For instance, a smartphone would not be ‘complex’ because the many components interact relatively simply and clearly. A system would not be complex if you could upgrade or replace a part and not have to change other elements in the system. This makes smartphones ‘simple’ even though they have thousands of individual components. You can swap out batteries or chips inside the phone and have everything else in the system work perfectly with the new component. On the other hand, wind turbines are ‘design-intensive’ (between simple and complex) because if you replace the blades with longer blades, you will have to change other parts of the turbine to compensate for the longer blades.
The way they define customization in the paper is more intuitive. Energy systems are ‘standardized’ if they are the same wherever they are mass-produced. A solar module is a standardized product because it functions and looks the same everywhere. Systems are ‘mass-customized’ if they have a standard platform you can build on, but you still need to tweak based on the specific site you are on. Rooftop solar PV systems are a great example of how installation and mounting structures are adapted to where you are using the system. ‘Customized’ systems like nuclear power plants are site-specific and depend on various conditions. They are the furthest away from being mass-produced.
There are a few points to remember when looking at the degree of complexity vs the need for customization in the graph above. First, introducing more modularity removes bottlenecks and accelerates learning but doesn’t directly cause innovation. Finding the right timing is tricky because premature standardization can hinder innovation.
Second, the chart will help you identify which technologies will likely be winners and losers based on how likely they are to ride a learning curve. It also helped me realize that if nothing is done to make nuclear plants less complex and customized, they will be too prohibitively expensive compared to other technologies that have been riding the learning curve for decades. This is also true for small nuclear reactors, which are still very complex despite being touted as the winning candidate for data center firm energy generation.
Finally, ‘Type 3’ technologies like nuclear plants are often silos built in individual countries with very little cross-pollination of ideas. International knowledge (sluggish at best) sharing won’t happen because of current geopolitics and because no one has the financial incentive to share extremely lucrative ideas that work across borders. I’m more optimistic about industrial policies or economic incentives for ‘Type 2’ technologies to accelerate their learning cycles.